
Table of Contents
- What Is Solar Payback Period and Why It Matters
- The Solar Payback Period Formula: How to Calculate It
- Factors Affecting Solar Payback Period
- Solar Incentives 2025: How They Reduce Payback Time
- Solar Battery Payback Period: Storage Integration
- Inflation and Rising Utility Costs: Long-Term Payback Advantage
- Real-World Example: Calculating Your Payback Period
- Conclusion: Making Your Solar Investment Decision
Last Updated: July 21, 2026
What Is Solar Payback Period and Why It Matters
The solar payback period is your break-even point, when cumulative energy savings equal your system’s upfront cost. It represents the number of years until your solar installation pays for itself through reduced electricity bills. A typical residential system reaches payback in 5 to 12 years, depending on location, energy consumption, system size, and available incentives.
Understanding this timeline is essential for informed decision-making. Once you’ve reached payback, every kilowatt-hour your system generates becomes pure savings. Knowing when this occurs helps you evaluate whether solar aligns with your financial goals and long-term energy independence plans.
The solar payback period is your break-even point, when cumulative energy savings equal your system’s upfront cost. Everything earned after that is pure profit through reduced utility bills.
The Solar Payback Period Formula: How to Calculate It
Calculating your payback period requires three inputs: total system installation cost, annual energy savings, and upfront incentives. The formula is straightforward: divide your net system cost (after incentives) by your annual energy savings.
Step 1: Determine Your Total System Installation Cost
Document your complete upfront investment from your installer’s quote, including panels, inverter, mounting hardware, electrical components, and labor. For most Australian installations, this varies based on system capacity (measured in kilowatts).
Step 2: Calculate Your Annual Energy Savings
Determine your system’s expected annual output in kilowatt-hours based on your location, roof orientation, and shading. A typical 5kW system in Brisbane produces around 6,500-7,000 kWh annually, while the same system in Melbourne might produce 5,500-6,000 kWh.

Multiply your annual kWh production by your current electricity rate. If your system produces 6,500 kWh per year at $0.28 per kilowatt-hour, your gross annual savings equal $1,820. Account for system degradation (approximately 0.5% annually) and maintenance costs.
Step 3: Apply Federal Solar Tax Credit and Incentives
Australia’s Small-scale Renewable Energy Scheme (SRES) provides small-scale technology certificates (STCs) that reduce your out-of-pocket cost. These certificates typically save thousands of dollars depending on system size and location. Deduct these incentives from your installation cost.
Step 4: Apply the Formula
Net System Cost ÷ Annual Energy Savings = Payback Period (Years)
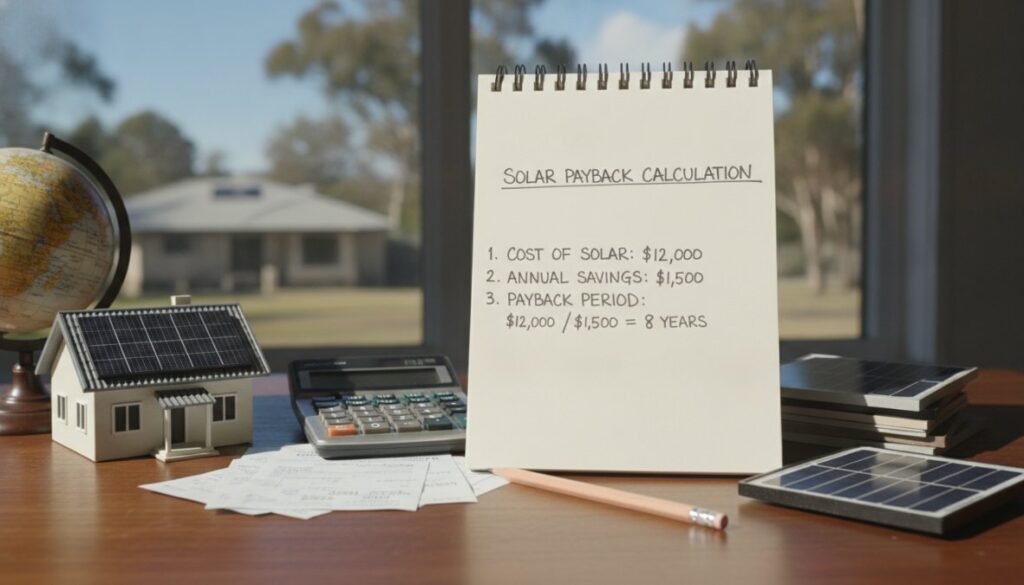
Example: A $12,000 system with $2,000 in incentives costs $10,000 net. If annual savings are $1,500, your payback period is 6.67 years, or approximately 6 years and 8 months.
Request detailed production estimates from your installer based on your specific roof characteristics and local climate data. This documentation is the foundation for accurate payback calculations.
Using a Solar Panel Payback Calculator
Solar payback calculators eliminate guesswork by integrating your postcode, roof specifications, electricity rates, and available incentives to generate personalized projections. These tools allow you to test different system sizes and financing scenarios instantly, helping you find the optimal configuration for your situation rather than relying on generic recommendations.
Factors Affecting Solar Payback Period
Multiple variables influence how quickly your system reaches profitability.
System Installation Cost and Capacity
Larger systems cost more initially but generate proportionally more electricity. However, oversizing wastes money, excess electricity may not be adequately compensated through feed-in tariffs. Premium panels with higher efficiency ratings cost more upfront but produce more electricity per square meter, which matters if roof space is limited.
Installation labor costs vary significantly by region. Rural areas often have higher labor costs due to travel time. Complex roof designs or structural upgrades increase expenses. Ensure quotes from different installers specify identical equipment and scope.
Your Annual Energy Savings and Utility Rates
Your electricity rate is the multiplier that transforms kilowatt-hour production into dollar savings. Higher rates accelerate payback dramatically. A system in an area paying $0.35 per kilowatt-hour reaches payback significantly faster than an identical system paying $0.20 per kilowatt-hour.
Your annual energy consumption determines how much of your system’s output you’ll use versus export to the grid. A household consuming 20 kWh daily benefits more from a 5kW system than one using 10 kWh daily. Excess production is exported at lower feed-in tariff rates, reducing effective savings.
Impact of Time-of-Use (TOU) Rates
Time-of-Use pricing charges different rates depending on consumption time. Peak rates (typically 2 PM to 8 PM) might be $0.45 per kilowatt-hour while off-peak rates are $0.18 per kilowatt-hour. Solar systems produce peak output during midday hours, which may coincide with moderate rates rather than peak rates.
If you shift consumption patterns, running dishwashers and laundry during peak solar production, you capture maximum value. Battery storage becomes particularly valuable under TOU pricing, allowing you to store midday production for use during peak-rate evening hours.
Solar Incentives 2025: How They Reduce Payback Time
Federal and state incentives are the single largest factor improving solar payback periods. These programs reduce your net investment, directly accelerating your break-even timeline.
Federal Solar Tax Credit and ITC Benefits
Australia’s Small-scale Renewable Energy Scheme (SRES) provides certificates representing your system’s environmental benefit over its 15-year compliance period. Current market prices typically range from $30 to $40 per certificate. A 5kW system might generate 60-80 certificates, worth $1,800 to $3,200 at current prices. This incentive alone can reduce your payback period by 2-3 years.
The federal incentive framework sunsets gradually, meaning benefits decrease each year. Systems installed sooner capture larger incentive benefits than future installations, making timing important.
Rebates, Net Metering, and Feed-In Tariffs
Some states offer additional rebates or interest-free solar loans. Feed-in tariff rates determine what you’re paid for excess electricity exported to the grid. In most Australian regions, feed-in tariffs are significantly lower than consumption rates, typically $0.08 to $0.15 per kilowatt-hour compared to $0.25 to $0.40. Maximizing self-consumption through load shifting or battery storage improves your effective savings rate.
Solar Battery Payback Period: Storage Integration
Adding battery storage changes the payback calculation significantly. While batteries increase upfront investment, they improve energy independence and can accelerate overall payback under specific circumstances.
When Battery Storage Accelerates Your Payback
Battery storage doesn’t directly reduce your solar system’s payback period, solar panels alone pay for themselves through electricity savings. However, batteries become financially attractive with high feed-in tariff rates that make exporting electricity unattractive, time-of-use rates where storing solar production for evening peak rates provides significant value, or frequent power outages where backup power has tangible value.
For most Australian households, install solar first, monitor your actual consumption and export patterns for 12 months, then decide whether battery storage aligns with your situation. This approach avoids oversizing battery capacity and ensures decisions are based on real data.
Financing vs. Cash Purchase: Impact on Timeline
A cash purchase requires substantial upfront capital but avoids interest payments. A solar loan spreads payments over time, allowing you to benefit from energy savings while paying for the system, but interest costs reduce net savings.
A typical solar loan at 6% interest over 10 years increases total cost by approximately 33% compared to cash purchase. However, if energy savings exceed your monthly loan payment, you’re cash-flow positive from month one.
Power Purchase Agreements (PPAs) and solar leases represent another approach. Under a PPA, a third party owns your system and you purchase its electricity at a fixed rate (typically 10-20% below your current utility rate). This eliminates upfront cost but sacrifices long-term savings.
PPA and lease arrangements typically have early termination penalties that can cost thousands of dollars. Understand these terms before signing.
Inflation and Rising Utility Costs: Long-Term Payback Advantage
While your solar system’s output remains relatively stable (declining only 0.5% annually), utility rates typically increase 3-5% annually. This divergence creates a powerful long-term advantage for solar owners.
A household with a 10-year payback period under current rates will see actual savings accelerate as utility rates rise. By year 10, annual savings might be 40-50% higher than year-one savings due to rate increases alone. Your system actually pays for itself faster than initial calculations suggested.
Over a 25-year system lifespan, this inflation effect becomes dramatic. A system that appears marginal at today’s rates becomes highly profitable as electricity costs rise. The levelized cost of energy (LCOE) for solar, the average cost per kilowatt-hour over the system’s lifetime, becomes increasingly favorable. Most solar systems have an LCOE of $0.08-0.12 per kilowatt-hour, competitive with projected grid electricity costs over 25 years.
Real-World Example: Calculating Your Payback Period
Scenario: Brisbane household, 5kW system, all-electric home
- System installation cost: $14,500
- Available SRES incentives: $2,200
- Net system cost: $12,300
- Annual electricity consumption: 18,000 kWh
- Current electricity rate: $0.32 per kilowatt-hour
- Expected system output: 6,800 kWh annually
- Self-consumption rate: 65%
Calculating annual savings:
- Self-consumed electricity: 6,800 × 0.65 = 4,420 kWh at $0.32 = $1,414
- Exported electricity: 6,800 × 0.35 = 2,380 kWh at $0.12 feed-in tariff = $286
- Total annual savings: $1,700
- Payback period: $12,300 ÷ $1,700 = 7.2 years
This household reaches payback in approximately 7 years and 2 months. Over 25 years, they’ll save approximately $45,000 in electricity costs, representing a 365% return on their $12,300 investment.
With battery storage added ($8,000 after incentives):
- Battery enables shifting 1,500 kWh to peak evening hours, increasing effective value from $0.12 to $0.35 per kWh
- Additional annual savings: $345
- Combined system cost: $20,300
- Combined annual savings: $2,045
- Payback period: 9.9 years
The battery extends combined payback to 9.9 years but increases total 25-year savings substantially through greater energy independence.
With solar loan financing ($12,300 over 10 years at 6% interest):
- Monthly loan payment: approximately $145
- Monthly energy savings: $142
- Monthly cash flow: nearly neutral initially
As utility rates rise, savings exceed the fixed loan payment, creating positive cash flow by year five.
| Factor | Impact on Payback | Example |
|---|---|---|
| Higher electricity rates | Reduces payback period | $0.35/kWh vs $0.25/kWh = 2-3 year difference |
| Larger system size | Usually reduces payback | 6kW vs 5kW = 1 year faster payback |
| Battery storage | Extends combined payback but improves total savings | Adds 2-3 years to payback but increases 25-year savings |
| SRES incentives | Reduces net cost significantly | $2,000-3,000 incentive = 1.5-2 year faster payback |
| Loan financing | Extends payback by interest costs | 6% interest over 10 years adds ~3 years to payback |
| Rising utility rates | Accelerates actual payback below projections | 3% annual rate increases = payback 1-2 years faster than calculated |
Calculating your solar system payback period transforms an abstract investment into concrete financial planning. The payback period reveals when your system begins generating pure profit, helping you understand whether solar aligns with your financial timeline and goals.
At Solazone Australia, we’ve spent over 40 years helping Australian households and businesses calculate accurate payback periods tailored to their unique situations. Our team analyzes your roof characteristics, current electricity usage, and local incentive programs to provide realistic projections. We understand that every property is different, shading patterns, roof orientation, and energy consumption vary significantly even within the same suburb. This personalized analysis ensures your payback calculation reflects your actual circumstances. Australian solar incentive programs and SRES scheme details provide the foundation for understanding available incentives, while state-based solar rebates and financing options vary by location. Get started with Solazone Australia and receive a detailed payback analysis for your property, including multiple financing scenarios and long-term savings projections.
Frequently Asked Questions
What is a good solar payback period for Australian homes?
A solar payback period between 5-8 years is generally considered good for Australian homes, though this varies by location, energy consumption, and system size. After the break-even point, your photovoltaic system continues generating free electricity for 20+ years, maximizing your return on investment. Factors like available sunlight, local utility rates, and installed capacity all influence whether your payback falls within this range.
How do I use a solar panel payback calculator accurately?
A solar panel payback calculator requires accurate inputs: your annual energy consumption (in kWh), system installation cost, expected annual energy savings, and local electricity rates. Enter your roof's solar potential and any applicable incentives or tax credits. The calculator then divides total system cost by annual savings to estimate break-even years. Ensure you update rates regularly, as utility bill inflation affects payback timelines significantly.
Do solar incentives 2025 really shorten payback period?
Yes, solar incentives substantially reduce payback time. The federal solar tax credit (ITC) and state rebates can offset 30% or more of system installation costs upfront. Net metering programs credit you for excess kilowatt-hours fed back to the grid, increasing annual savings. Feed-in tariffs and buyback plans further improve your return on investment. These incentives directly lower the numerator in your payback formula, accelerating your break-even point.
Is a solar battery payback period worth calculating separately?
Yes, battery storage has a different payback timeline than grid-tied solar panels alone. While batteries increase upfront costs, they maximize savings if you have high Time-of-Use (TOU) rates, frequent power outages, or off-grid goals. Calculate battery payback by comparing the added system cost against energy independence gains and demand charge reductions. In many cases, batteries extend overall payback but deliver long-term resilience and utility bill reduction benefits beyond simple ROI.
How does utility rate inflation affect my long-term solar payback?
Utility rate inflation accelerates your effective payback period and boosts long-term savings. If electricity rates rise 2-3% annually (common in Australia), your annual energy savings grow each year, shortening the break-even point. A system that appears to break even in 7 years at current rates may actually reach payback in 6 years when inflation is factored in. This hidden advantage makes solar a hedge against rising kilowatt-hour costs over your system's 25+ year lifespan.
What's the difference between cash purchase and financing for payback calculations?
Cash purchase eliminates interest costs, shortening payback time, but requires large upfront capital. Solar financing (loans or PPAs) spreads costs over time, reducing immediate out-of-pocket expense but extending payback due to interest. However, financing allows you to start saving immediately on utility bills, offsetting loan payments. Compare the levelized cost of energy (LCOE) under both scenarios: cash often wins on total cost, but financing may offer better cash flow and faster ROI realization.
This article was written using GrandRanker